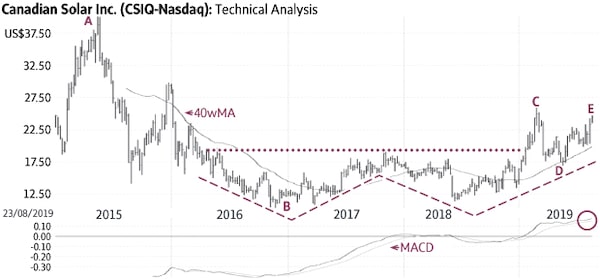
Canadian Solar Inc. (Friday’s close $22.74) declined from $40.08 in May, 2015, to $10.25 in November, 2016, (A-B) and then settled in a bullish technical pattern known as a Double Bottom formation (solid lines). The subsequent rise above the neckline of this pattern (dotted line) signalled a breakout and the start of a new up-leg (C).
Subsequently, the stock pulled back to its 40-week Moving Average (40wMA), where it appears to have found good support (D). The recent rise above ±$22 suggests the resumption of the up-trend (E).
Behaviour indicators including the rising 40wMA confirm the bullish status. Only a sustained decline below $19-20 would be negative.
Point & Figure measurements provide targets of $26 and $29. The large Double Bottom formation supports higher targets.
rb-gi-meisels-0824stock
Monica Rizk is the senior Technical Analyst and Ron Meisels is the president of Phases & Cycles Inc. (www.phases-cycles.com). And he tweets at @Ronsbriefs. They may hold shares in companies profiled.
Chart source: www.decisionplus.com
 Monica Rizk
 Ron Meisels