
It seems a basic question: What is the most deadly type of work in Canada?
The answer isn’t readily available. While data are produced on the annual number of death claims by occupation, Canada – unlike other developed countries – doesn’t produce worker fatality rates. For example, high numbers of truck drivers die each year. But trucking employs a lot of workers, so is the risk of an on-the-job fatality actually higher? (By fatality rate, it still ranks in the top 12 most risky jobs, we found.)
Worker fatality rates give important insights. Not only do they show where workers face higher chances of not coming home at night, they also allow comparisons of high-risk sectors with lower-risk ones, and insights into whether safety is improving or deteriorating over time. Ultimately, all of that can provide evidence that could be used to make work safer – and prevent unnecessary deaths.
We also wanted to separate anecdote from evidence. For example, each year, numerous reports detail police dying in the line of duty. Are their risks greater than, say, those of roofers? (In fact, our data show, roofers are five times more likely to die on the job.)
The last time Statscan produced analysis on worker fatality rates was 1996 (and it noted that, though fatality counts are important, “a more telling indicator of risk is the fatality rate.”).
The Globe and Mail, with input from the Association of Workers’ Compensation Boards of Canada, the non-profit Institute for Work & Health, and Statscan, set out to produce these rates. Our goal was to draw attention to a key data gap in Canada, and to illustrate how one might fill it by calculating worker fatality rates by industry and occupation.
The data are not perfect – see the note on data considerations, below. But we drew from the best sources available. Where possible, we used other data sets to fill in gaps.
We looked at best practices, including the U.S. census of fatal occupational injuries, Australia’s work-related traumatic-injury-fatalities data, and Britain’s Fatal Injuries Arising From Accidents At Work report, along with past Canadian studies, to validate our approach. Analysis compiled in other countries yields rich insights – details that don’t exist in Canada, such as fatal injuries among self-employed workers; how fatality rates have changed over the past decade; and fatality rates by race or ethnic origin.
To add context and meaning to these numbers, we conducted more than 50 interviews with family members, health and safety experts, academics, labour reps, government officials and sector associations. The process took about four months to complete.
Back in 1996, Statscan noted that monitoring workplace fatalities “can shed light on the effectiveness of safety policies and programs over time, and help pinpoint work environments that may require further preventive intervention.”
When the agency calculated these rates two decades ago, it included a long list of data limitations. The data are still imperfect today. Worker safety, nonetheless, is a matter of public interest. Ultimately, we hope this will highlight a major data gap in Canada and provide insights into the scale and nature of on-the-job fatalities – all with the hope of avoiding preventable deaths.
Here’s how we did it:
We started by looking for the best-available count on the number of workers by occupation who die each year. The best single source for this data is from the Association of Workers’ Compensation Boards of Canada, which collects accepted fatality claims from each province and produces numbers on an annual basis. Detailed multi-year data by occupation must be purchased.
To avoid year-to-year fluctuations – for example, one year where a single accident may have affected the numbers – we asked for data over the past decade, ending in 2015 because that was the most recent year in which national data are available.
One method, used in some countries, uses a range of sources for worker death counts, including workers’ comp, coroners’ reports and death certificates. For this project, we opted to replicate Statscan previous fatality study which used just workers’ comp data.
It doesn’t contain every single worker death in Canada (see below), but it’s the most complete single dataset available.
The first request showed the sheer numbers of workers that die each year.
The five occupations with the highest number of fatalities, 2006-2015

Note: Excludes fatalities that were “Not coded” by occupation. THE GLOBE AND MAIL » SOURCE: AWCBC
This showed nearly 10,000 worker death claims in the past decade. Truck drivers had the highest absolute number of job-related deaths in Canada, at 773 recorded fatalities. Firefighters, construction labourers, underground miners and labourers in mineral processing also had high death counts.
Many of the claims stem from long-term occupational exposures to carcinogens, most notably asbestos, which remains the top on-the-job source of fatalities in Canada, a subject The Globe has covered extensively in recent years.
Firefighters are a statistical anomaly – they have high fatality numbers, particularly for cancers. They are at an elevated risk for certain cancers; however, they have special legislation in many provinces which automatically recognizes their cancers came from their jobs. This makes it look like they have much higher fatalities than other occupations, when in fact they’re not really comparable to other occupations that don’t have this presumptive clause, such as miners.
For the purpose of this story, we wanted to focus on traumatic, on-the-job fatalities – deaths that occur after an acute injury at work. Traumatic events include intracranial injuries, suffocations, cuts, burns, drownings, electrocutions, and dying from extreme heat.
This is similar to other countries’ methods. The U.S. occupational fatality census data focuses on traumatic injuries rather than longer-term illnesses, because “of the latency period associated with many occupational illnesses and the difficulty in definitively linking illness cases to work exposures,” said Jill Janocha of the Bureau of Labor Statistics.
We obtained these by re-ordering a list of fatalities by occupation, restricting the nature of injury to just coded under traumatic injuries and disorders.
We also narrowed down the time frame to five years to get the most current picture possible and because it was easier to match job coding between AWCBC and Statscan, when it came to calculating a rate.
Fatalities by occupation, excluding long-term illnesses, 2011-2015
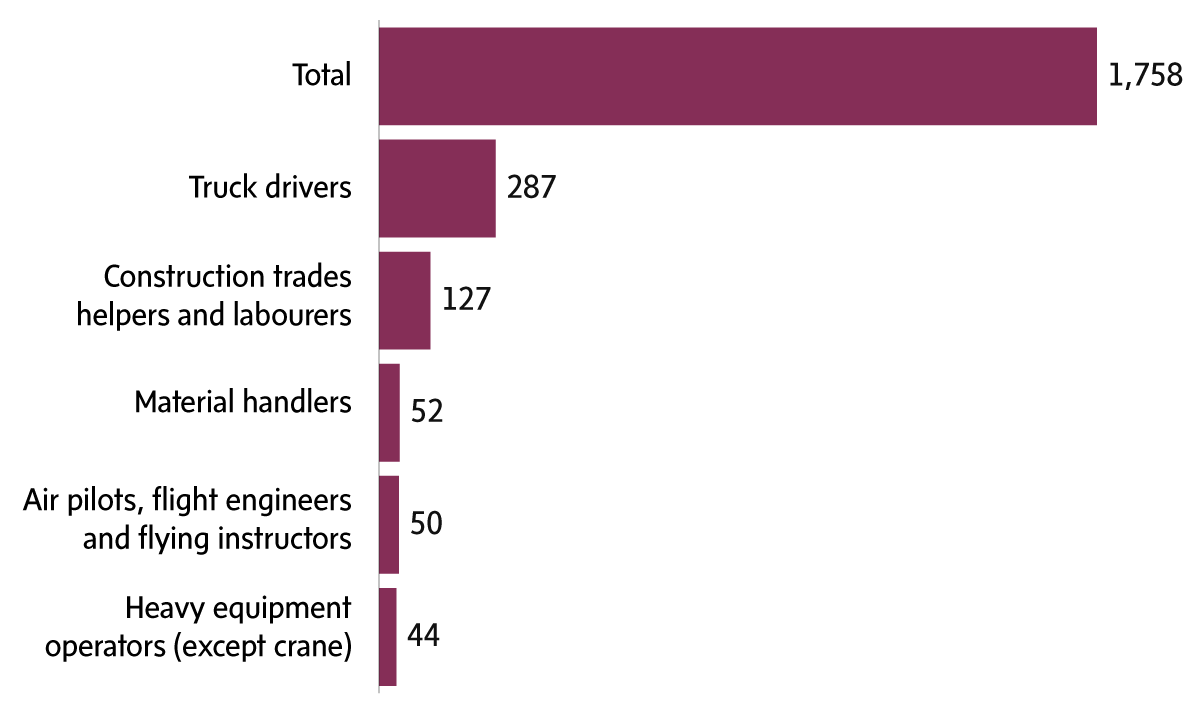
Note: Excludes fatalities that were “Not coded” by occupation. THE GLOBE AND MAIL » SOURCE: AWCBC
This showed an average of about 352 fatalities from a traumatic injury in Canada per year. Again, truck drivers have the highest absolute number of deaths.
By gender, men are far more likely to die on the job. In the five-year period, 93 per cent of workplace fatalities were among men.
We also requested annual fatalities from traumatic injury counts by industry.
The 10 industries with the highest number of traumatic injury fatalities, 2011-2015

THE GLOBE AND MAIL » SOURCE: AWCBC
We wanted to know proportionally where risks of on-the-job deaths are the highest.
To arrive at a fatality rate, we asked Statistics Canada to replicate what the agency had done in its 1996 paper: match worker death counts with average head-count levels for each job, over the same time period, to arrive at a rate per 100,000 paid workers.
Statscan labour market analyst Andrew Fields used employee counts from the Labour Force Survey to calculate fatality rates, and included a note on methodology, below.
Self-employed workers don’t typically fall under mandatory workers’ comp coverage, so they were excluded from the employee counts (we did run a separate calculation that included the self-employed in the worker counts; this showed forestry and fishing are still the top two most deadly industries).
He also compiled employee numbers by industry, to calculate fatality rates by sector.
This gave a five-year average picture of worker fatality rates by industry.
Average fatality rate for traumatic injuries by industry, 2011-2015

THE GLOBE AND MAIL » SOURCE: Statistics Canada, AWCBC
This showed fishing and trapping has the highest fatality rate (fishing constitutes all of the category). Statscan’s 1996 study also found that the fishing and trapping industry was most dangerous.
Forestry has the second-highest rate.
The next chart showed worker fatality rates by occupation.
For this list, we selected the jobs that had four deaths or more over the five-year period. We set this threshold because any occupations that had between one and three deaths were marked by workers’ comp with an “X” – thus making it difficult to determine whether they had one, two or three deaths in that period.
Jobs with zero fatalities in the five years weren’t included in the list from worker’s comp. And Statscan excluded occupations with few workers (less than 1,500), due to confidentiality reasons.
This left us with a total of 83 occupations.
The results gave a picture of worker fatality rates by occupation.
The 20 occupations with the highest average (traumatic injury) fatality rates, 2011-2015

THE GLOBE AND MAIL » SOURCE: Statistics Canada, AWCBC
This showed that chainsaw and skidder operators – a category that includes workers who fell trees – have the highest fatality rate in Canada. Fishing vessel deckhands have the second-highest rate, followed by air pilots and flying instructors, logging and forestry labourers, and fishing vessel skippers and fishermen.
It also showed that trucking remains a dangerous job. With an average of 57 fatalities a year, in an industry that employs about 245,000 people, it is the 11th-most deadly job in Canada.
We verified the results using our own calculations, in consultation with Globe data scientist Shengqing Wu.
We honed in on fishing because, although it’s a relatively small industry, it has the highest fatality rate. By occupation, three of the top six most fatal jobs are in fishing.
Workers’ comp numbers don't always capture all on-the-job deaths, so we cross-checked fatalities in the fishing industry with those recorded in the Transportation Safety Board’s marine database.
We requested customized data from the TSB that focused exclusively on deaths in commercial fishing (rather than other marine fatalities). This data also includes missing persons.
The TSB data showed more than 200 deaths since 1999 in fishing. With its head-count numbers in the same years (which they took from the Department of Fisheries and Oceans), we could look at changes over time and see whether fatality rates have improved. They haven’t, at least relative to 1999 levels.
Fishing fatality rate, 1999-2015
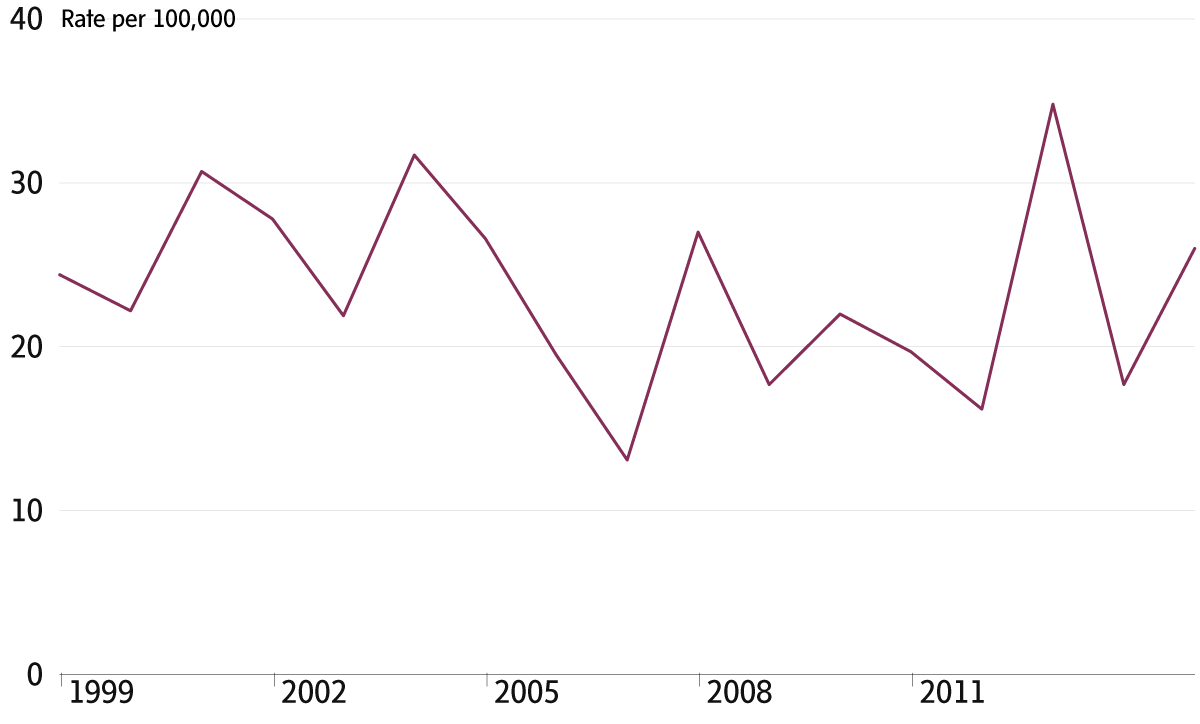
Note: Rate not yet available for 2016 THE GLOBE AND MAIL » SOURCE: TSB
And we looked at fatality rates in other industries, such as agriculture, to see how they compare.
Agriculture fatality rate, 1990-2012

THE GLOBE AND MAIL » SOURCE: CANADIAN AGRICULTURAL INJURY REPORTING
The methodology in the agriculture calculations isn’t precisely the same as in the fishing calculations. But it does suggest that another industry – which has long had high fatality numbers – is seeing sustained improvements, whereas fishing has not.
We asked Dr. Cameron Mustard of the Institute for Work & Health and Dr. Sean Tucker, associate professor at the University of Regina, for feedback on methodology to ensure our approach was sound.
Data limitations
Workers’ comp numbers do not fully capture the whole work force. As of 2015, 85 per cent of workers in Canada were covered. Among provinces, this coverage ranges from 73 per cent in Nova Scotia to 98 per cent in British Columbia.
As well, not everyone files a claim, and not every claim is accepted.
Some occupations or industries in some jurisdictions (such as fishing in Prince Edward Island and dairy farming in Saskatchewan) are excluded from compulsory coverage, and thus may not appear in the data; among types of workers, the self-employed may be under-represented in the AWCBC data.
Though there are likely cases of deceased workers that are unrecorded in the workers’ comp database, it’s hard to pinpoint the extent of the under-count.
Coding practices and definitions may differ from province to province, and coding may change over time, affecting comparability.
Some deaths are listed as “not coded,” and others didn’t have corresponding codes for employee counts, so we had to eliminate them.
Another limitation is the timeliness of national data. National figures are only available for up to 2015; we couldn’t analyze what last year’s trends looked like.
In the occupation data, any deaths that numbered between one and three were marked with an X, for confidentiality reasons. Because we couldn’t determine whether this meant one, two or three deaths, if their five-year total was three or fewer deaths, we eliminated them from the ranking.
Some occupations were eliminated because Statscan suppressed them due to confidentiality, as they had fewer than 1,500 workers.
In the industry rankings, the worker’s comp system uses a version of industry codes that is older than the one Statscan uses. Statscan matched them up as best as it could, but one area – finance, insurance and real estate – was difficult to compare.
Because the data didn’t include occupations with zero fatalities, we couldn’t compare all individual occupations with an overall average.
Note from Statistics Canada’s Andrew Fields
Fatality rate: In addition to fatality count, another telling indicator of the risk is the fatality rate, which expresses the number of work-related deaths per 100,000 paid employees. The rate represents the average number of employees in a particular occupational group who died from a fatal injury, disease or illness resulting from their employment, between 2011 and 2015, divided by the annual average of employees for that group during that period.
As an example, the national fatality rate for employees in the truck driver occupation from 2011 to 2015 is calculated as follows:
((N / 5) / W ) * 100,000
N = the total number of work-related fatalities among truck driver employees from 2011 to 2015 (from the AWCBC)
W = the annual average number of truck driver employees from 2011 to 2015 (from the LFS)
The ratio is multiplied by 100,000 which allows the rate to be expressed in whole numbers, and represents the number of deaths per 100,000 employees.
An employment-based fatality rate such as this one does have limitations; it does not reflect the movement of workers in and out of the work force, nor does it account for type of work performed (for example, part-time or part-year employment, multiple job holders), which may differ for various groups. A number of factors may affect fatality rates: worker experience, number of hours worked, physical and other demands on the job, occupational environment, condition of equipment, human error, legislation, and the presence and effectiveness of health and safety regulations. The Labour Force Survey is a sample survey and thus subject to sampling errors.
Acknowledgments
The Globe is grateful to all the family members who shared their stories, and the pain of their loss, with us.
For their advice and assistance in this project, thank you to Leonard LeBlanc, long-time fisherman and managing director of the Gulf Nova Scotia Fleet Planning Board in Cheticamp, Nova Scotia. Thanks to Andrew Fields at Statistics Canada, Dr. Cameron Mustard of the Institute of Work & Health, and Dr. Paul Demers at the Occupational Cancer Research Centre.
And thank you to those who helped us make connections: Threads of Life, which runs family support programs; the Fisheries Safety Association of Nova Scotia, and the Workers’ Compensation Board of NS; in Ontario, Chris Ramsaroop of Justicia For Migrant Workers.