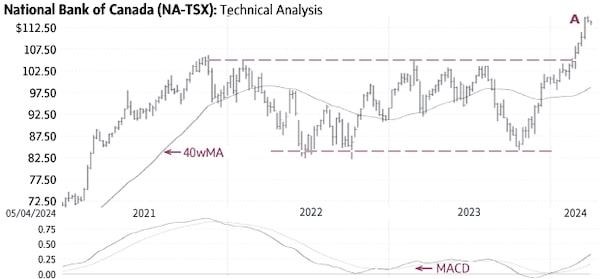
National Bank of Canada (NA-T, Wednesday’s close $112.92) remained in a wide horizontal trading range mostly between $85 and $105 for about two years (dashed lines). Earlier this year, the stock rallied above the top of this range to signal a breakout and the start of a new uptrend toward higher targets (A).
Behaviour indicators, including the rising 40-week Moving Average (40wMA), confirm the bullish status. National Bank is becoming overbought as it rallies far above the 40wMA, which increases the possibility of a minor correction, either in price (toward the average) or in time (horizontal trading range). There is good support near ±$105; only a sustained decline below $100-105 would be negative.
Point & Figure measurements provide an initial target of $124. The large trading range (dashed lines) supports higher targets.
stock
Monica Rizk is the Senior Technical Analyst of the Phases & Cycles publication (www.capitalightresearch.com). Chart source: www.decisionplus.com
 Monica Rizk